Salesforce enhances sales pipeline visibility through real-time data and collaborative tools. A 2026 CloudApps report reveals only 25% of companies forecast within 5% accuracy, with nearly half missing targets by over 10%. Salesforce users achieve 45% better forecasting accuracy via collaborative features, according to American Chase analysis. Manufacturers with formalized Salesforce processes report 18% higher revenue growth from improved pipeline management.
Sales Pipeline Basics
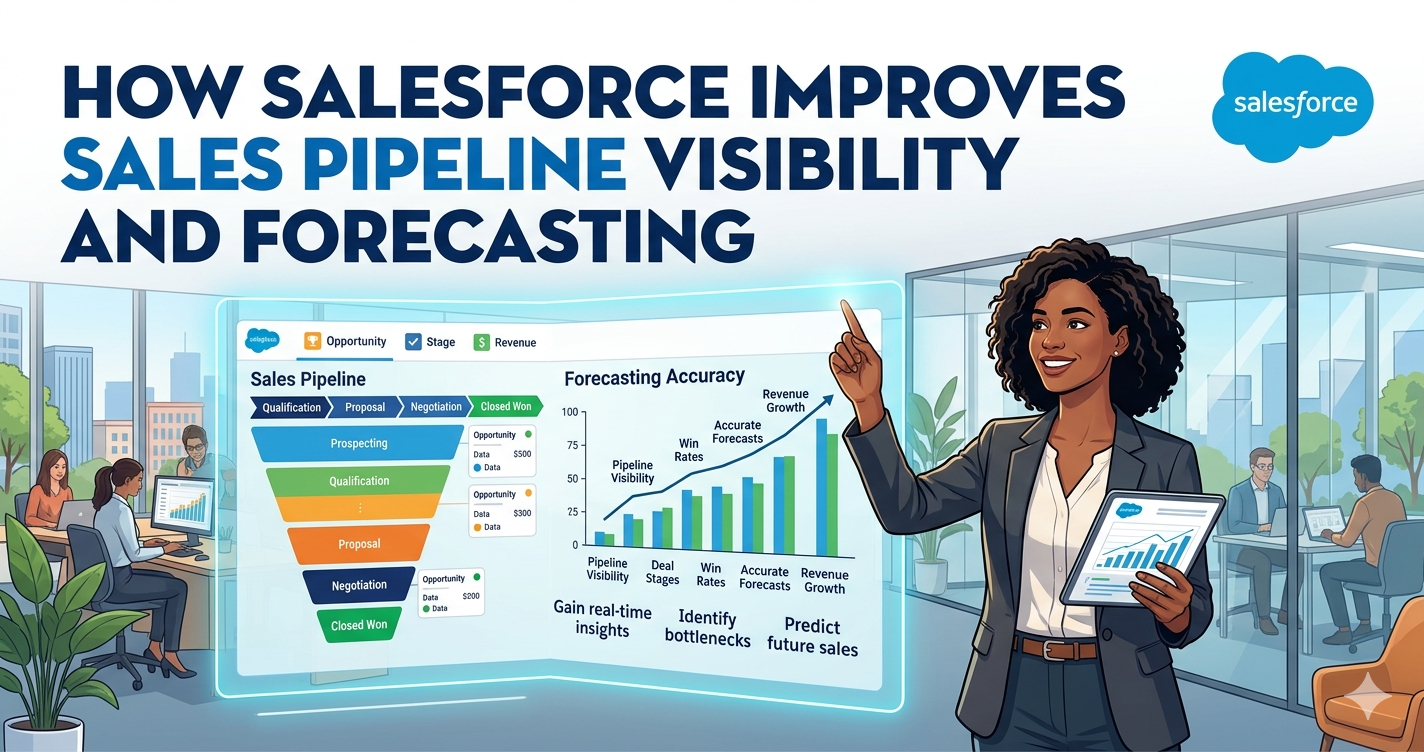
Sales pipelines track opportunities from lead to close. Stages include qualification, proposal, negotiation, and won/lost. Visibility means reps and managers see progress, risks, and health at a glance.
Poor visibility leads to stalled deals and inaccurate forecasts. Teams guess revenue based on gut feel, causing production mismatches or cash flow issues. Salesforce centralizes this data in one platform, accessible via dashboards and reports.
Pipeline inspection uncovers bottlenecks. Managers review stage duration, conversion rates, and aging opportunities weekly. This practice reveals underreported deals or stalled negotiations early.
Core Salesforce Features for Visibility
Salesforce provides Opportunity objects as the pipeline foundation. Custom fields capture deal size, close date, and next steps. Path and Kanban views visualize stages with guidance for reps.
Real-time updates sync across teams. Mobile apps let field reps log activities instantly, reflecting changes in manager dashboards. Reports filter by rep, region, or product, highlighting imbalances.
Einstein Opportunity Scoring adds AI insights. The model assigns health scores based on engagement signals, predicting win probability. Reps prioritize high-scoring deals, managers spot at-risk opportunities.
Forecasting Methods in Salesforce
Salesforce supports multiple forecasting categories: Pipeline, Best Case, and Forecast. Reps commit to Forecast for high-confidence deals, Pipeline for all qualified opportunities.
Collaborative Forecasts aggregate manager overrides. Executives adjust rollups quarterly, aligning with revenue targets. Custom forecast types, like product family, track specific lines.
Einstein Forecasting uses machine learning on historical data. It predicts close rates per stage, outperforming manual methods. Accuracy targets 85-95%, calculated as (1 – |Forecast – Actual| / Actual) × 100.
Dashboard and Reporting Tools
Lightning Dashboards display key metrics: pipeline coverage ratio, velocity, and win rates. Widgets show funnel charts and aging reports.
List views segment opportunities by criteria. Managers drill into details, like deals over 30 days in negotiation.
Scheduled reports email weekly snapshots. Integration with Tableau CRM enables advanced analytics, such as predictive trends from IoT-linked sales data in manufacturing.
AI-Driven Enhancements
Einstein surfaces deal insights proactively. It flags stalled opportunities and suggests actions based on past wins.
Forecast Manager visualizes rollups with color-coded categories. AI agents, adopted by 54% of sellers in 2026, automate research, cutting time by 34%.
These tools integrate with external data, like ERP systems, for holistic views. A Salesforce development company builds custom Einstein models tailored to industry nuances.
Real-World Case Study: HD Supply
HD Supply, a $8 billion industrial distributor, implemented Salesforce Sales Cloud for pipeline visibility. Legacy systems hid deal details, leading to forecasting errors and missed quotas.
Post-deployment, close rates rose 19%, stagnant deals dropped 63%, and close-date changes fell 25% in the first year. Pipeline reviews became standard, with managers inspecting health scores weekly.
Revenue grew 47% year-over-year. The firm unified direct and partner channels, enabling accurate production planning. Custom apps from Salesforce development services handled complex pricing approvals.
ROI and Business Impact
Salesforce pipeline tools yield tangible returns. Users report 27% ROI increase, 32% lead conversion growth, and 37% sales productivity gains.
Key metrics:
- Forecasting accuracy up 30-45%.
- Sales cycle reduction by 20-25%.
- Win rates improve 15-19%.
- Administrative time cut 34% via AI.
Payback averages 12 months. Manufacturers avoid overproduction waste through real-time visibility. Salesforce development services customize for scale, amplifying impacts.
Comparison of Forecasting Approaches
Best Practices for Implementation
Define clear stage criteria. Qualification requires demos completed; negotiation needs proposals sent. Train reps on consistent updates.
Conduct weekly pipeline reviews. Managers inspect top deals, coach on risks, and adjust forecasts. Use agendas with metrics: deal count, velocity, win rates.
Maintain data hygiene. Dedupe records, validate close dates quarterly. Automation rules flag inconsistencies.
Integrate systems. MuleSoft connects ERP for order data, feeding forecasts. A Salesforce development company ensures seamless APIs.
Common Challenges and Solutions
Data entry lags erode visibility. Enforce mandatory fields and activity logging. Gamify updates with leaderboards.
Forecast sandbagging skews accuracy. Tie incentives to pipeline health, not just quota attainment. Collaborative overrides promote realism.
Adoption varies across teams. Provide role-based Trailhead training. Start with sales, expand to ops.
Scalability hits large orgs. Custom objects handle complex deals. Salesforce development services optimize performance.
Final Thoughts
Salesforce turns pipeline visibility and forecasting from educated guesses into clear, reliable insights. Real-time tools, smart AI predictions, and team collaboration features help nail down revenue expectations. Businesses benefit from consistent processes and decisions backed by solid data. Team up with a Salesforce development company to build custom tweaks that match your setup perfectly. Keep checking your metrics and adjusting your approach to stay ahead in tough markets.