 Sign up with Google
 Sign in with Zoho

The global agricultural supply chain operates under constant pricing pressure. Geopolitical events, volatile natural gas markets, shifting export policies, freight logjams, and unpredictable weather patterns continuously reshape commodity costs. For procurement managers, agribusinesses, chemical manufacturers, and traders, relying on reactive purchasing strategies leaves operating margins exposed to sudden spikes and cost overruns.
Navigating this environment requires transitioning from guesswork to high-fidelity, structured pricing intelligence. By utilizing Grand View Signal early in the strategic planning process, industry leaders can leverage fertilizers pricing intelligence to analyze real-time dynamics across nitrogen, phosphate, and potash fertilizer markets. Grounded in monthly tracking, historical datasets spanning over a decade, granular Average Selling Price (ASP) metrics, and risk-quantification modeling, data-driven pricing intelligence provides the roadmap required to optimize contract timing and secure 15-25% in procurement cost savings.
The Three Pillar Fertilizer Sub-Sectors: Market Dynamics
The fertilizer complex is not a monolith. Pricing vectors vary significantly depending on raw feedstock costs, processing economics, and regional trade flows across the three primary chemical categories.
1. Nitrogen Fertilizers
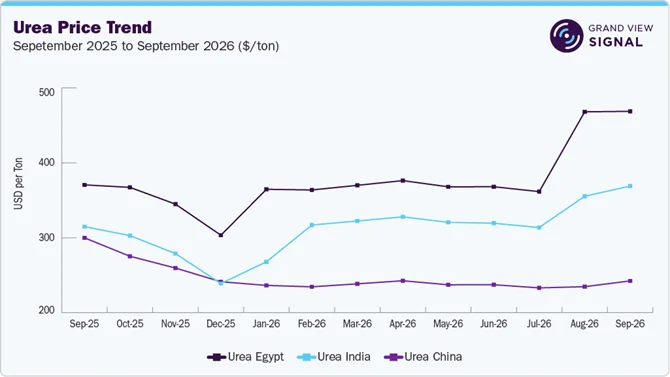
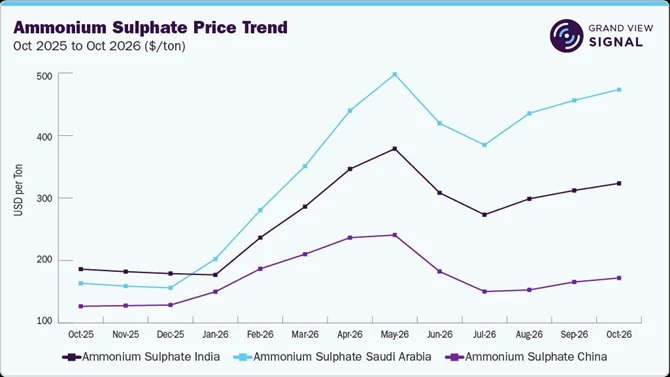
Comprising key SKUs such as urea, ammonium sulfate, and ammonium nitrate, the nitrogen complex is deeply tied to energy feedstock markets. Nitrogen synthesizes primary nutrients from natural gas or coal, making production economics highly sensitive to regional energy price shifts. Key volatility drivers include plant turnaround schedules, natural gas price spikes, domestic supply recoveries, and international export restrictions. For instance, localized shifts, such as plant maintenance recoveries in major exporting nations like China or delayed spring ordering in European markets, frequently create supply bottlenecks that ripple through international benchmarks. Notably, as highlighted in market tracking data, urea emerged as a top mover with an average month-on-month (MoM) growth of 2.4% across top geographies while maintaining a stable volatility profile.
2. Phosphate Fertilizers
Centered on critical crop nutrients like monoammonium phosphate (MAP), phosphate fertilizer dynamics depend heavily on raw material cost structures and downstream compound formulation demand. Key volatility drivers include mining output of phosphate rock, cost fluctuations in essential feedstocks like sulfur and ammonia, and domestic industrial utilization rates. Shifts in the freight market can also impact ocean shipping costs and import timing for major bulk shipments. Price trends often display localized diverging patterns; while domestic MAP quotations may ease in production hubs like Hubei due to softer feedstock costs or temporary inventory drawdowns, retail prices in major destination markets like the United States can simultaneously show firm resilience due to localized logistics and import timing.
3. Potash Fertilizers
Encompassing muriate of potash (MOP), potassium nitrate, and sulfate of potash (SOP), potash nutrition serves broad field crops as well as low-chloride specialty agriculture. Key volatility drivers include geographic mining concentration, port and border inventory levels, international freight rates, and long-term supply contract discussions. Market movements are often dictated by inventory overhangs at key discharge ports alongside long-term trade developments, such as shifting availability from major Eastern European producers.
Regional Price Assessment & Market Outlook
Rather than treating global fertilizer pricing as a uniform trend, data-driven pricing intelligence evaluates localized price assessments, trade restrictions, and energy shifts across key production and consumption hubs.
Asia Pacific (China & India)
- China: Fertilizer prices dropped 1.8% on average, with 5 out of 7 assessed products trending lower. MAP experienced a sharp 9.3% drop as domestic supply built up due to phosphate export restrictions. Urea fell 1.4% under heavy inventory stocks and sluggish agricultural demand, while MOP declined 2.3% as port inventories accumulated. Ammonium sulfate stood as the primary exception, rising 3.9% on its monthly average despite spot prices dropping 5.8% in October due to slowing export momentum.
- India: Urea import quotations dropped 4.8% following the October 7th import tender, where lowest offers came in approximately 10% below August benchmarks. Only ~410 kt was secured against the 1.7 Mt sought, pointing toward an upcoming 2 Mt tender. Indian DAP dropped to its lowest mark since April, while MOP contract pricing held steady. Ammonium sulfate and ammonium nitrate posted gains of 3.6% and 3.0%, respectively, trailing strength from earlier Chinese market movements.
Europe & the UK (France & Germany)
- Europe & Germany: European prices were broadly unchanged overall, though nitrogen products gained traction. Urea rose 1.2% and MOP gained 1.5%, whereas potassium nitrate fell 2.5% and SOP decreased 1.6%. European gas prices reached their highest point since December 2022, prompting ammonia plant curtailments and driving up import demand. German fertilizer prices held flat on average, with urea rising 1.5% and MOP climbing 1.9%, as below-normal gas storage levels prevented German nitrogen prices from tracking global declines despite quiet autumn farm demand.
- France: French fertilizer pricing ticked down 0.4% on average, though urea managed a 0.8% increase. Market dynamics were altered by Algeria instructing producers to halt urea shipments to France, impacting a supplier that historically accounts for around 30% of French urea imports and forcing importers to turn toward Egyptian and alternative supply pools ahead of spring.
- United Kingdom: UK prices remained flat overall. Our UK urea assessment rose 1.3% and MOP gained 1.6%, while potassium nitrate fell 2.4% and SOP slipped 1.8%. Domestic and imported ammonium nitrate recorded a modest 0.3% week-on-week increase as buyers largely deferred purchases ahead of spring pricing announcements.
North America
- United States: U.S. fertilizer prices rose 0.5% on average. Retail anhydrous ammonia surged 5% month-on-month during mid-October, and retail urea sat 13% higher year-over-year. In contrast, U.S. import urea fell 3.0% due to quiet purchasing activity, with import volumes reaching an eight-year low and freeing up ocean cargoes for other global destinations.
Middle East & North Africa (Saudi Arabia, UAE, Egypt, Morocco)
- Saudi Arabia & UAE: Saudi prices held steady overall, though granular urea fell 5.5% as Middle Eastern quotes dropped 4-9% following India’s lower tender results. Imported ammonium sulphate (+3.8%) and MOP (+3.6%) rose as elevated freight and war-risk insurance rates in the freight market persisted following regional maritime disruptions. UAE fertilizer prices rose 0.2% on average; urea dropped 5.1%, while imported ammonium sulphate (+3.7%) and MOP (+3.4%) rose due to shipping expenses. ADNOC lowered its October sulphur price by 7.3%, bringing cost relief to regional phosphate producers.
- Egypt & Morocco: Egyptian prices remained flat, though urea gained 1.8% as European buyers sought replacement supply for Algerian tonnage. Exporters also benefited from an Egyptian pound that averaged 3.8% weaker against the U.S. dollar. Moroccan prices decreased 0.5% on average; MAP held flat, but OCP benefited from lower global sulphur input costs following a first half where sulphur costs had tripled and EBITDA fell 28.5%. A 3.7% depreciation in the dirham against the dollar provided additional support to Moroccan export revenues.
Tangible Outcomes Across the Agricultural Value Chain
Access to transparent, forecast-ready price intelligence generates measurable commercial value across every link of the agricultural supply chain:
- Manufacturers: Fertilizer producers leverage forward-looking ASP forecasts and raw material tracking (such as ammonia, sulfur, and rock phosphate) to optimize raw feedstock procurement, refine production scheduling, negotiate better supplier contracts, and capture 15-25% in direct cost savings.
- End Users & Large Agribusinesses: Farm managers and commercial agricultural enterprises make informed timing decisions on input purchases, protect operating margins against seasonal spikes, enhance bidding competitiveness, and manage cost pass-through strategies effectively.
- Traders & Distributors: Supply chain intermediaries monitor international price spreads, spot arbitrage opportunities between regions, manage port inventory exposure, and respond rapidly to emerging price signals.
Securing Competitive Advantage in Volatile Commodity Markets
As fertilizer markets navigate volatile energy prices, evolving trade policies, and shifting global demand, relying on fragmented market chatter creates unnecessary risk. High-performing procurement teams rely on data-grounded intelligence to manage exposure.
By integrating monthly retrospective tracking, granular ASP metrics, over a decade of historical records, and predictive risk analytics, platforms like Grand View Signal turn market volatility into strategic advantage. Structuring your sourcing workflow around high-fidelity pricing intelligence ensures your organization buys with precision, protects margins, and builds long-term supply chain resilience.